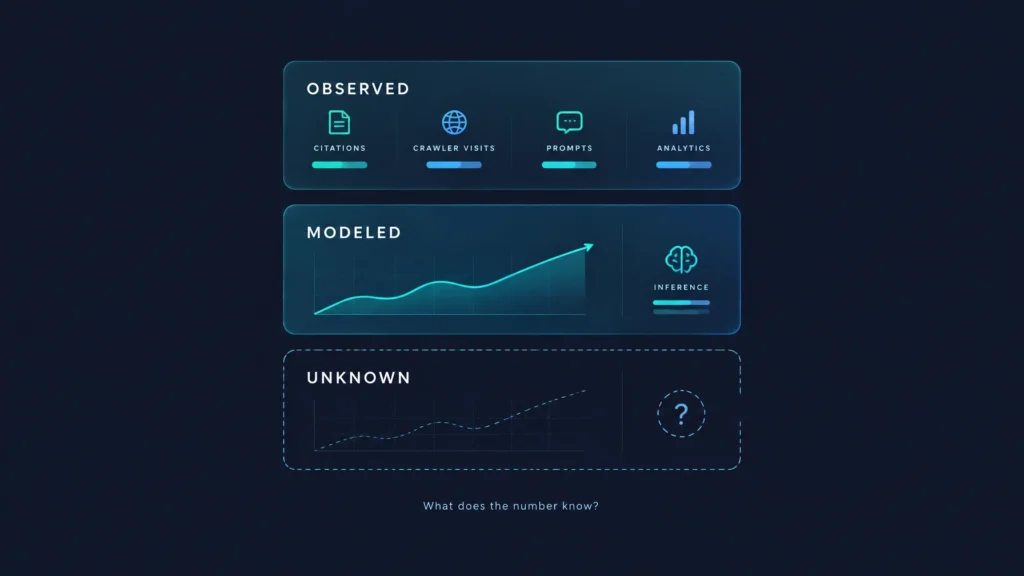
In a dashboard, a counted number and an estimated number can look exactly the same.
Duane Forrester makes this point in Duane Forrester Decodes: both numbers may appear as clean, confident figures in a chart, but only one can be checked. The other is an interpretation presented with the visual authority of a fact.
That distinction matters everywhere in marketing analytics. It matters even more in AI visibility.
A credible AI visibility dashboard should not only tell you what changed. It should tell you what it directly observed, what it inferred from those observations, and what it cannot see.
AI visibility is measured through a sample
Traditional analytics also involves assumptions, but many of its core events are directly recorded.
A pageview is recorded by an analytics system. A form submission creates an event. A crawler request appears in server logs. These measurements still require configuration and interpretation, but the underlying event happened in a system you can inspect.
AI visibility is different.
You are usually monitoring a defined set of prompts across a defined set of AI platforms. You record whether your brand appeared, how it was described, which sources were cited, and how competitors appeared in the same answers.
That is valuable evidence. But it is still a sample of a much larger system.
You cannot directly observe every private conversation someone has with an assistant. You cannot see every personalized answer shown to a logged-in user. You cannot know how many people saw a response unless the platform provides that information. And you cannot assume that a monitored prompt represents every real-world variation of the question.
This does not make AI visibility measurement invalid. It means the measurement needs a clear label.
As Search Engine Land’s guide to building an AI search visibility dashboard illustrates, the challenge is not simply choosing more metrics. It is understanding that different metrics have different evidentiary strength.
The right response is not to stop measuring. It is to stop presenting every measurement as if it were a direct count.
The three buckets every dashboard needs
A practical AI visibility reporting system should separate metrics into three buckets: observed, modeled or directional, and unknown.

| Bucket | Examples | What it can and cannot support |
|---|---|---|
| Observed | Recorded citations, mentions, crawler visits, AI-referred sessions, prompts and responses, source pages, scan timestamps | Can support statements about what was recorded in a defined sample and time period. Cannot prove total AI audience, all assistant answers, or universal market visibility. |
| Modeled or directional | Influence on consideration, assisted conversions, estimated category share, trend projections, Impact analysis, demand-side proxies | Can support prioritization, directional analysis, and informed hypotheses. Cannot be treated as a directly counted outcome or causal proof without supporting business data. |
| Unknown | Private assistant conversations, logged-in personalization, unsampled surfaces, hidden retrieval, journeys that never register | Cannot support a precise conclusion. Should be disclosed as a blind spot rather than filled with a confident estimate. |
1. Observed: what was directly recorded
Observed metrics are the foundation of an AI visibility program.
Examples include:
- A citation appearing in a recorded AI response
- The wording used to mention or describe your brand
- The page or domain cited as a source
- A crawler visiting your website
- The date and frequency of those crawler visits
- A session referred by an AI platform in Google Analytics 4 or Adobe Analytics
- A prompt, response, platform, and scan timestamp stored by the monitoring system
These observations should be inspectable. A team should be able to move from a chart to the evidence behind it: the response, citation, source page, platform, and date.
At CiteMetrix, this includes AI Crawlers, which shows which AI crawlers visited your site, when they visited, and how often. It also includes Analytics, Activity Tracking, Source Pages, and Google AIO monitoring.
These are not interchangeable signals. A crawler visit does not prove a citation. A citation does not prove a click. An AI-referred session does not prove that the assistant caused the entire conversion journey.
The value is in keeping those distinctions visible.
2. Modeled: what the evidence suggests
Modeled metrics are not inherently bad. In many cases, they are the only practical way to connect fragmented signals.
The problem starts when an inference is presented without its inputs, assumptions, or limitations.
For example, a dashboard might estimate how AI visibility movement relates to business outcomes. That can help a marketing team prioritize work. But an estimate of influence is not the same as a recorded conversion attributed exclusively to an AI answer.
Similarly, Brand Demand can function as a useful demand-side proxy. If branded searches are increasing, that may indicate stronger awareness or consideration. But it does not prove why every search occurred, nor does it prove that AI visibility caused the increase.
Modeled metrics should answer a different question from observed metrics:
“What does the available evidence suggest?”
They should not pretend to answer:
“What happened in every case?”
Why the unknown bucket matters most
The unknown bucket is where many dashboards become misleading.
A system may have excellent data about the prompts it scanned and still have no visibility into private conversations, personalized answers, or unsampled platforms. Those gaps are not a temporary inconvenience. They are part of the measurement boundary.
A dashboard that acknowledges its blind spots is more useful than one that implies completeness.
If you know that a metric is based on a monitored prompt set, you can use it to compare periods, identify changes, and decide where to investigate. If you know that a platform does not expose audience-level impressions, you will avoid reporting a citation count as a reach number.
Unknowns improve decision quality because they define the decisions a measurement can support.
This is especially important for brand knowledge governance: the cross-functional discipline of keeping your brand’s facts, positioning, sources, and representations consistent across the systems that influence AI answers. Marketing, legal, product, content operations, and analytics teams need a shared understanding of what the data says, and where it stops.
How CiteMetrix makes the distinction
CiteMetrix is designed to make the measurement structure visible, not to hide it behind one score.
ModelScore™ is a composite 0–100 measure with four disclosed components:
- Mention Score, 45%: citation performance across nine engines, with sentiment and prominence weighted into the result
- Brand Demand, 20%: branded searches from Google Search Console, used as a demand-side proxy
- Authority Transfer, 20%: AI-referred traffic from GA4 or Adobe Analytics
- Technical Readiness, 15%: schema, crawlability, and
llms.txtreadiness

The point is not that a composite score becomes a direct measurement simply because it is calculated precisely. It does not.
The point is transparency. Every input is named and weighted openly, so a team can reason about why the number moved. If Brand Demand is unavailable because GSC is not connected, that limitation should be visible. If Mention Score changes because the scan sample changed, that context matters.
ModelScore is a decision-support metric, not a claim to universal visibility. Its interpretation should always be paired with the underlying platform results, prompt set, time period, and evidence.
CiteMetrix also gives teams access to the analysis beneath the headline number:
- Impact connects visibility movement to business outcomes, but remains directional rather than causal proof.
- Source Pages identifies the pages shaping observed answers.
- Activity Tracking provides an account-level record of scans, changes, and remediation actions.
- AI Crawlers exposes visits that ordinary web analytics may not show.
- Google AIO separates Google AI Overviews from conversational assistant results.
- Citation Scans stores the prompts and responses behind the measurement.
The platform uses BYOK, bring your own API keys for each supported platform, with no markup. That gives teams more control over scan volume and a clearer view of what is happening behind the numbers.
A practical standard for evaluating any AI visibility tool
The standard should apply to CiteMetrix, too.
Before trusting a dashboard, ask:
Is the methodology disclosed?
Can the vendor explain how prompts are selected, which platforms are monitored, how responses are classified, and how scores are calculated?
Are the inputs named?
A metric should identify the data sources behind it: prompt scans, citations, analytics, search data, crawler checks, or something else.
Is scan frequency stated?
A daily trend and a monthly trend are not the same measurement. Neither is automatically better, but the cadence should be clear.
Is sample size available?
You should know whether a trend is based on hundreds of observations or a much smaller sample. Precision without sample context is false confidence.
Can the vendor separate observation from inference?
Ask directly: Which numbers are recorded? Which are modeled? What cannot the product see?
Can you inspect the evidence?
A useful dashboard should lead to raw responses, cited pages, platform-level results, timestamps, and analysis, not just another summary score.
CiteMetrix’s Report Analysis is built for this operational layer. Teams can ask the Analyst about their actual numbers, save the answers into the PDF shared with a client, and use more than 10 report templates with PDF and PowerPoint export, shareable links, and scheduled delivery.
The CiteMetrix Analyst™ is available on analytical pages, reports, and mobile. It is a conversational strategist grounded in your data. That matters because interpretation should begin with the observed evidence, not with generic advice.
Better dashboards create better decisions
The goal of measurement integrity is not to make reporting sound less impressive.
It is to make reporting more useful.
An observed citation can lead to a content decision. A modeled trend can justify an investigation. An unknown can prevent an executive team from making an unsupported claim about reach, revenue, or market share.
That is the difference between a dashboard that merely reports numbers and one that supports judgment.
CiteMetrix brings nine features together across nine AI platforms on every plan, starting at $79 per month, with the goal of giving teams a glass-box view of AI visibility. But no platform can see everything. Our responsibility, and the responsibility of every vendor in this category, is to make the boundary visible.
Know what was observed. Label what was inferred. Name what remains unknown.
That is how AI visibility measurement earns trust.
Ready to see what AI knows about your brand, and how much of the picture is still outside the sample? Get your ModelScore and start tracking → citemetrix.com