By Eric Richmond, CiteMetrix
Search Engine Land recently published a useful warning for anyone measuring AI visibility.
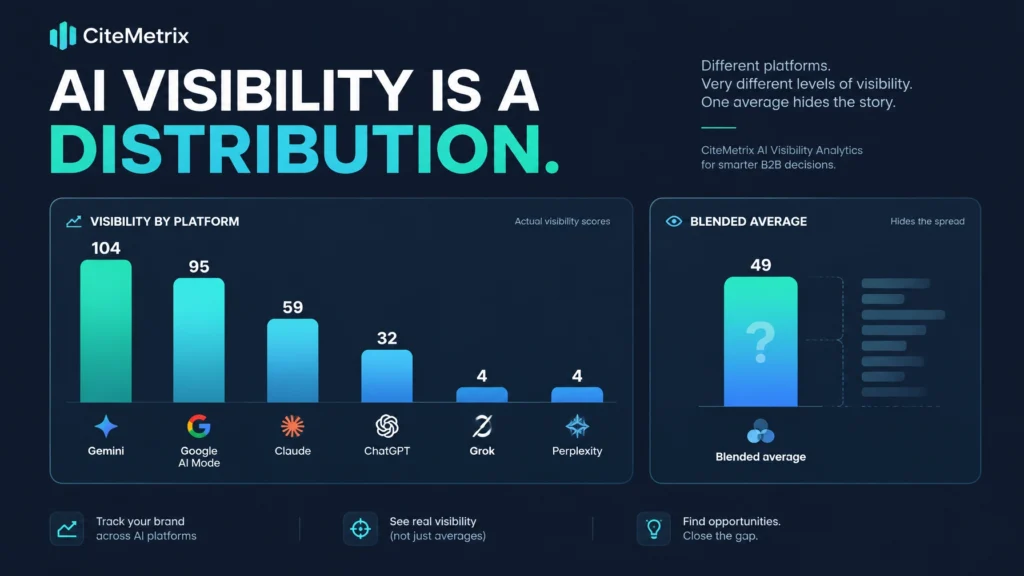
In a 30-day study of 15 commercial-intent SaaS keywords across six platforms, the publication logged 298 appearances split this way:
| Platform | Logged appearances |
|---|---|
| Gemini | 104 |
| Google AI Mode | 95 |
| Claude | 59 |
| ChatGPT | 32 |
| Grok | 4 |
| Perplexity | 4 |
Those figures come from Search Engine Land’s September 14, 2026 article, “Two GEO experiments challenge conventional AI visibility advice”, by Zeeshan Yaseen.
The twist is more important than the chart.
In the earlier experiment, ChatGPT led.
Same general questions. Different platform. Different answers. Different month.
That is the central measurement problem in AI search: AI visibility is not one number. It is a distribution.
And if your reporting collapses that distribution into one blended score, you may be hiding the information your team needs most.
A blended score can hide the real picture
A composite score is useful. It gives executives and operators a way to understand overall direction: Are we becoming more visible to AI systems, or less visible?
But averaging across platforms assumes the platforms are measuring roughly the same thing.
They are not.
AI assistants:
- Retrieve information from different indexes and source ecosystems
- Weight domains, sources, and entities differently
- Use different retrieval and ranking systems
- Apply different models and system instructions
- Change behavior as their products and data sources evolve
- Produce different answers from one run to the next
An average of six or nine different measurements can be mathematically tidy while being operationally vague.
Suppose your brand is highly visible on ChatGPT but rarely appears on Claude. A blended score may show a healthy middle ground. But if your most valuable buyers rely heavily on Claude, that “healthy” average may be masking a meaningful pipeline risk.
The average tells you that something is happening.
The distribution tells you where.
AI visibility has two kinds of variance
To measure AI visibility responsibly, teams need to account for two separate types of movement.
1. Cross-platform variance
This is the difference between assistants at the same point in time.
Your brand may appear prominently in Gemini, appear occasionally in Claude, and be absent from Perplexity for the same prompt category.
That does not necessarily mean one platform is broken. Each assistant is operating with different inputs and behavior. It does mean that “AI visibility” is not a single universal state.
A brand is not simply visible or invisible to AI.
It is visible to a particular platform, for a particular query, in a particular response context.

2. Longitudinal variance
This is the difference over time.
A brand may be cited this month and absent next month. A competitor may replace it in a recommendation. A source page may stop appearing. A model may change how it handles the same prompt.
The result can be a genuine visibility change, or simply the natural variability of AI responses.
That distinction matters.
If you take one sample, average it across platforms, and compare it with another single sample thirty days later, you cannot confidently tell whether a content change caused the movement. You may have captured a different run, a different retrieval set, or a different response pattern.

Why sampling matters
AI responses vary with both run conditions and prompt phrasing.
A small change in wording can alter:
- Which sources are retrieved
- Which competitors are considered
- Whether a brand is mentioned
- How prominently the brand is described
- Whether the response includes a citation
- The sentiment attached to the mention
This does not make measurement impossible. It makes casual measurement unreliable.
The answer is not to pretend that every scan is a permanent truth. The answer is to measure consistently enough to separate signal from noise.
That means using a stable prompt set, repeating it over time, and reporting the results at the platform level.
You want to know whether your brand is:
- Persistently absent
- Consistently visible
- Present but inconsistently cited
- Visible on one platform but not another
- Losing share to a named competitor
- Improving after a specific content or technical change
A single blended score cannot answer all of those questions.
A practical framework for measuring AI visibility
1. Report visibility by platform
Start with the direct view.
CiteMetrix provides per-platform breakdowns across all nine monitored engines:
- ChatGPT
- Perplexity
- Claude
- Google Gemini
- Grok
- Google AI Overviews
- Microsoft Copilot
- DeepSeek
- Mistral
This is the direct answer to blended-score blindness. Instead of asking only, “What is our AI visibility score?” you can ask:
- Where are we appearing?
- Where are we absent?
- Which platforms describe us accurately?
- Which platforms are giving competitors more visibility?
- Where is sentiment changing?
The CiteMetrix Analysis suite is designed to show both the headline trend and the platform-level reasons behind it.
2. Track a stable prompt set over time
Your prompt set should represent the questions buyers actually ask.
That might include:
- Category questions
- Product comparisons
- “Best of” recommendations
- Problem-based searches
- Industry-specific questions
- Brand and competitor comparisons
Keep a core set stable so that you can compare like with like. You can add exploratory prompts, but do not replace your baseline every month.
CiteMetrix stores the prompt, response, citations, sentiment, competitors, and source URLs for each scan. The Citation Scans documentation explains how those scans work and why repeated measurement matters.
3. Separate persistent absence from run-to-run variability
One missing citation is not always a problem.
Repeated absence across multiple scans and multiple relevant prompts is a stronger signal. So is a sustained decline on one platform over several measurement windows.
Your reporting should distinguish between:
| Pattern | What it may indicate |
|---|---|
| One-off absence | Normal response variability |
| Repeated absence on one platform | Platform-specific visibility gap |
| Decline across several scans | Potential content, competitor, or retrieval shift |
| Visibility on one platform only | Cross-platform distribution problem |
| Sudden change after an edit | Possible connection to a content or technical change |
This is where frequency and history become important. CiteMetrix uses a BYOK architecture: you connect your own API keys for each platform, and CiteMetrix does not add markup to provider costs. That makes frequent repeat scanning practical while keeping usage and spend visible to your team.
4. Set priorities based on your buyers
Do not treat all nine platforms as equivalent simply because they appear in the same dashboard.
Your priorities should reflect:
- Where your audience conducts research
- Which platforms influence your category
- Where competitors are winning
- Which platforms send referral traffic
- Which surfaces matter to your sales and content teams
For example, a B2B software company may prioritize ChatGPT, Claude, Gemini, and Perplexity. A brand tracking Google AI Overviews may need to treat that surface as a separate workstream. The correct priority depends on your audience and business model.
Where ModelScore fits
A platform-level view does not make a composite score useless.
It makes the composite score more honest.
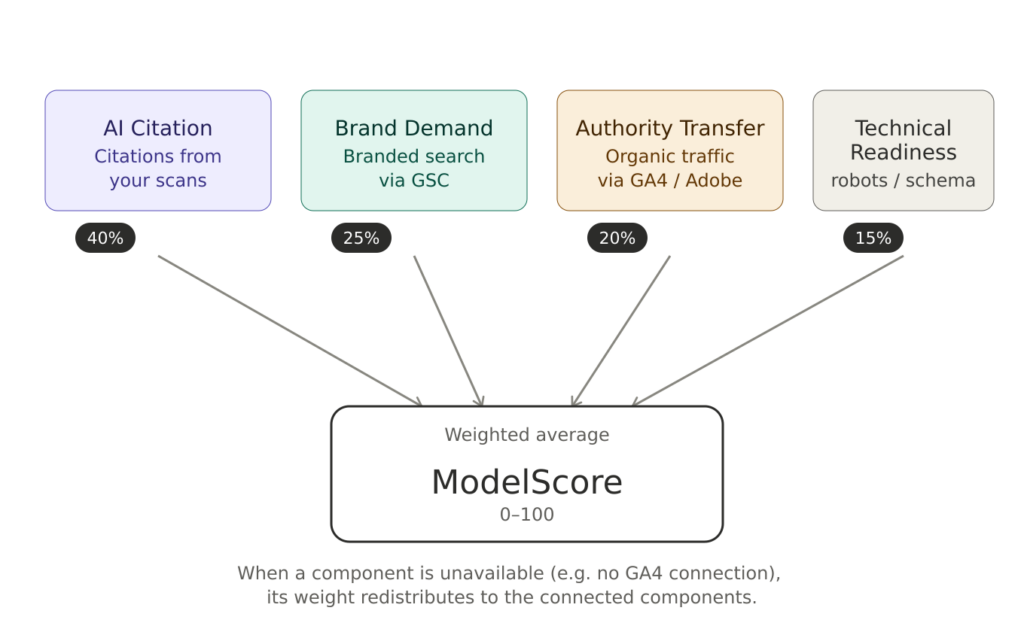
CiteMetrix ModelScore is a 0–100 trend metric built from four disclosed components:
| ModelScore component | Weight | What it measures |
|---|---|---|
| Mention Score | 45% | Citation rate across nine engines, weighted by sentiment and prominence |
| Brand Demand | 20% | Branded searches from Google Search Console |
| Authority Transfer | 20% | AI-referred traffic from GA4 or Adobe Analytics |
| Technical Readiness | 15% | Schema, crawlability, and llms.txt readiness |
ModelScore is useful for tracking direction. Is the overall program improving? Did the trend move after a coordinated set of changes? Are visibility and business outcomes moving together?
But the score should sit alongside the platform view, not replace it.
The same is true for other measurements:
- Share of Voice shows how you compare head-to-head with named competitors on every platform over time.
- Model Sentiment and Brand Perception show how each platform characterizes your brand, not just whether it mentions you.
- Content Change Tracker stores page snapshots on every scan, helping connect citation movement to a specific content change in the same window.
- Impact connects visibility movement to business outcomes so teams can evaluate more than citation volume.
Together, these views support what we call brand knowledge governance: the ongoing, cross-functional work of keeping your brand accurate, discoverable, and consistently represented across AI systems.
That work should involve marketing, SEO, legal, product, and content operations. A platform may cite an outdated product description, an incorrect comparison, or an unsupported claim. Fixing the issue is not only an SEO task.
The measurement argument
The goal is not to produce a more impressive number.
The goal is to make better decisions.
A blended score can tell you whether the broad trend is moving. Platform-level reporting tells you where the movement is happening. Repeated scans tell you whether it is persistent. Content snapshots help explain what changed. Impact data shows whether the change matters to the business.
That is the difference between reporting AI visibility and managing it.
CiteMetrix brings these capabilities together across nine AI platforms and nine connected features, with everything included on each plan. Business plans start at $79 per month, with no extra apps or add-ons required.
See how AI sees your brand, and which platforms need attention → citemetrix.com